Muvin: MUltidimensional VIsualization of Networks
Muvin: MUltidimensional VIsualization of Networks
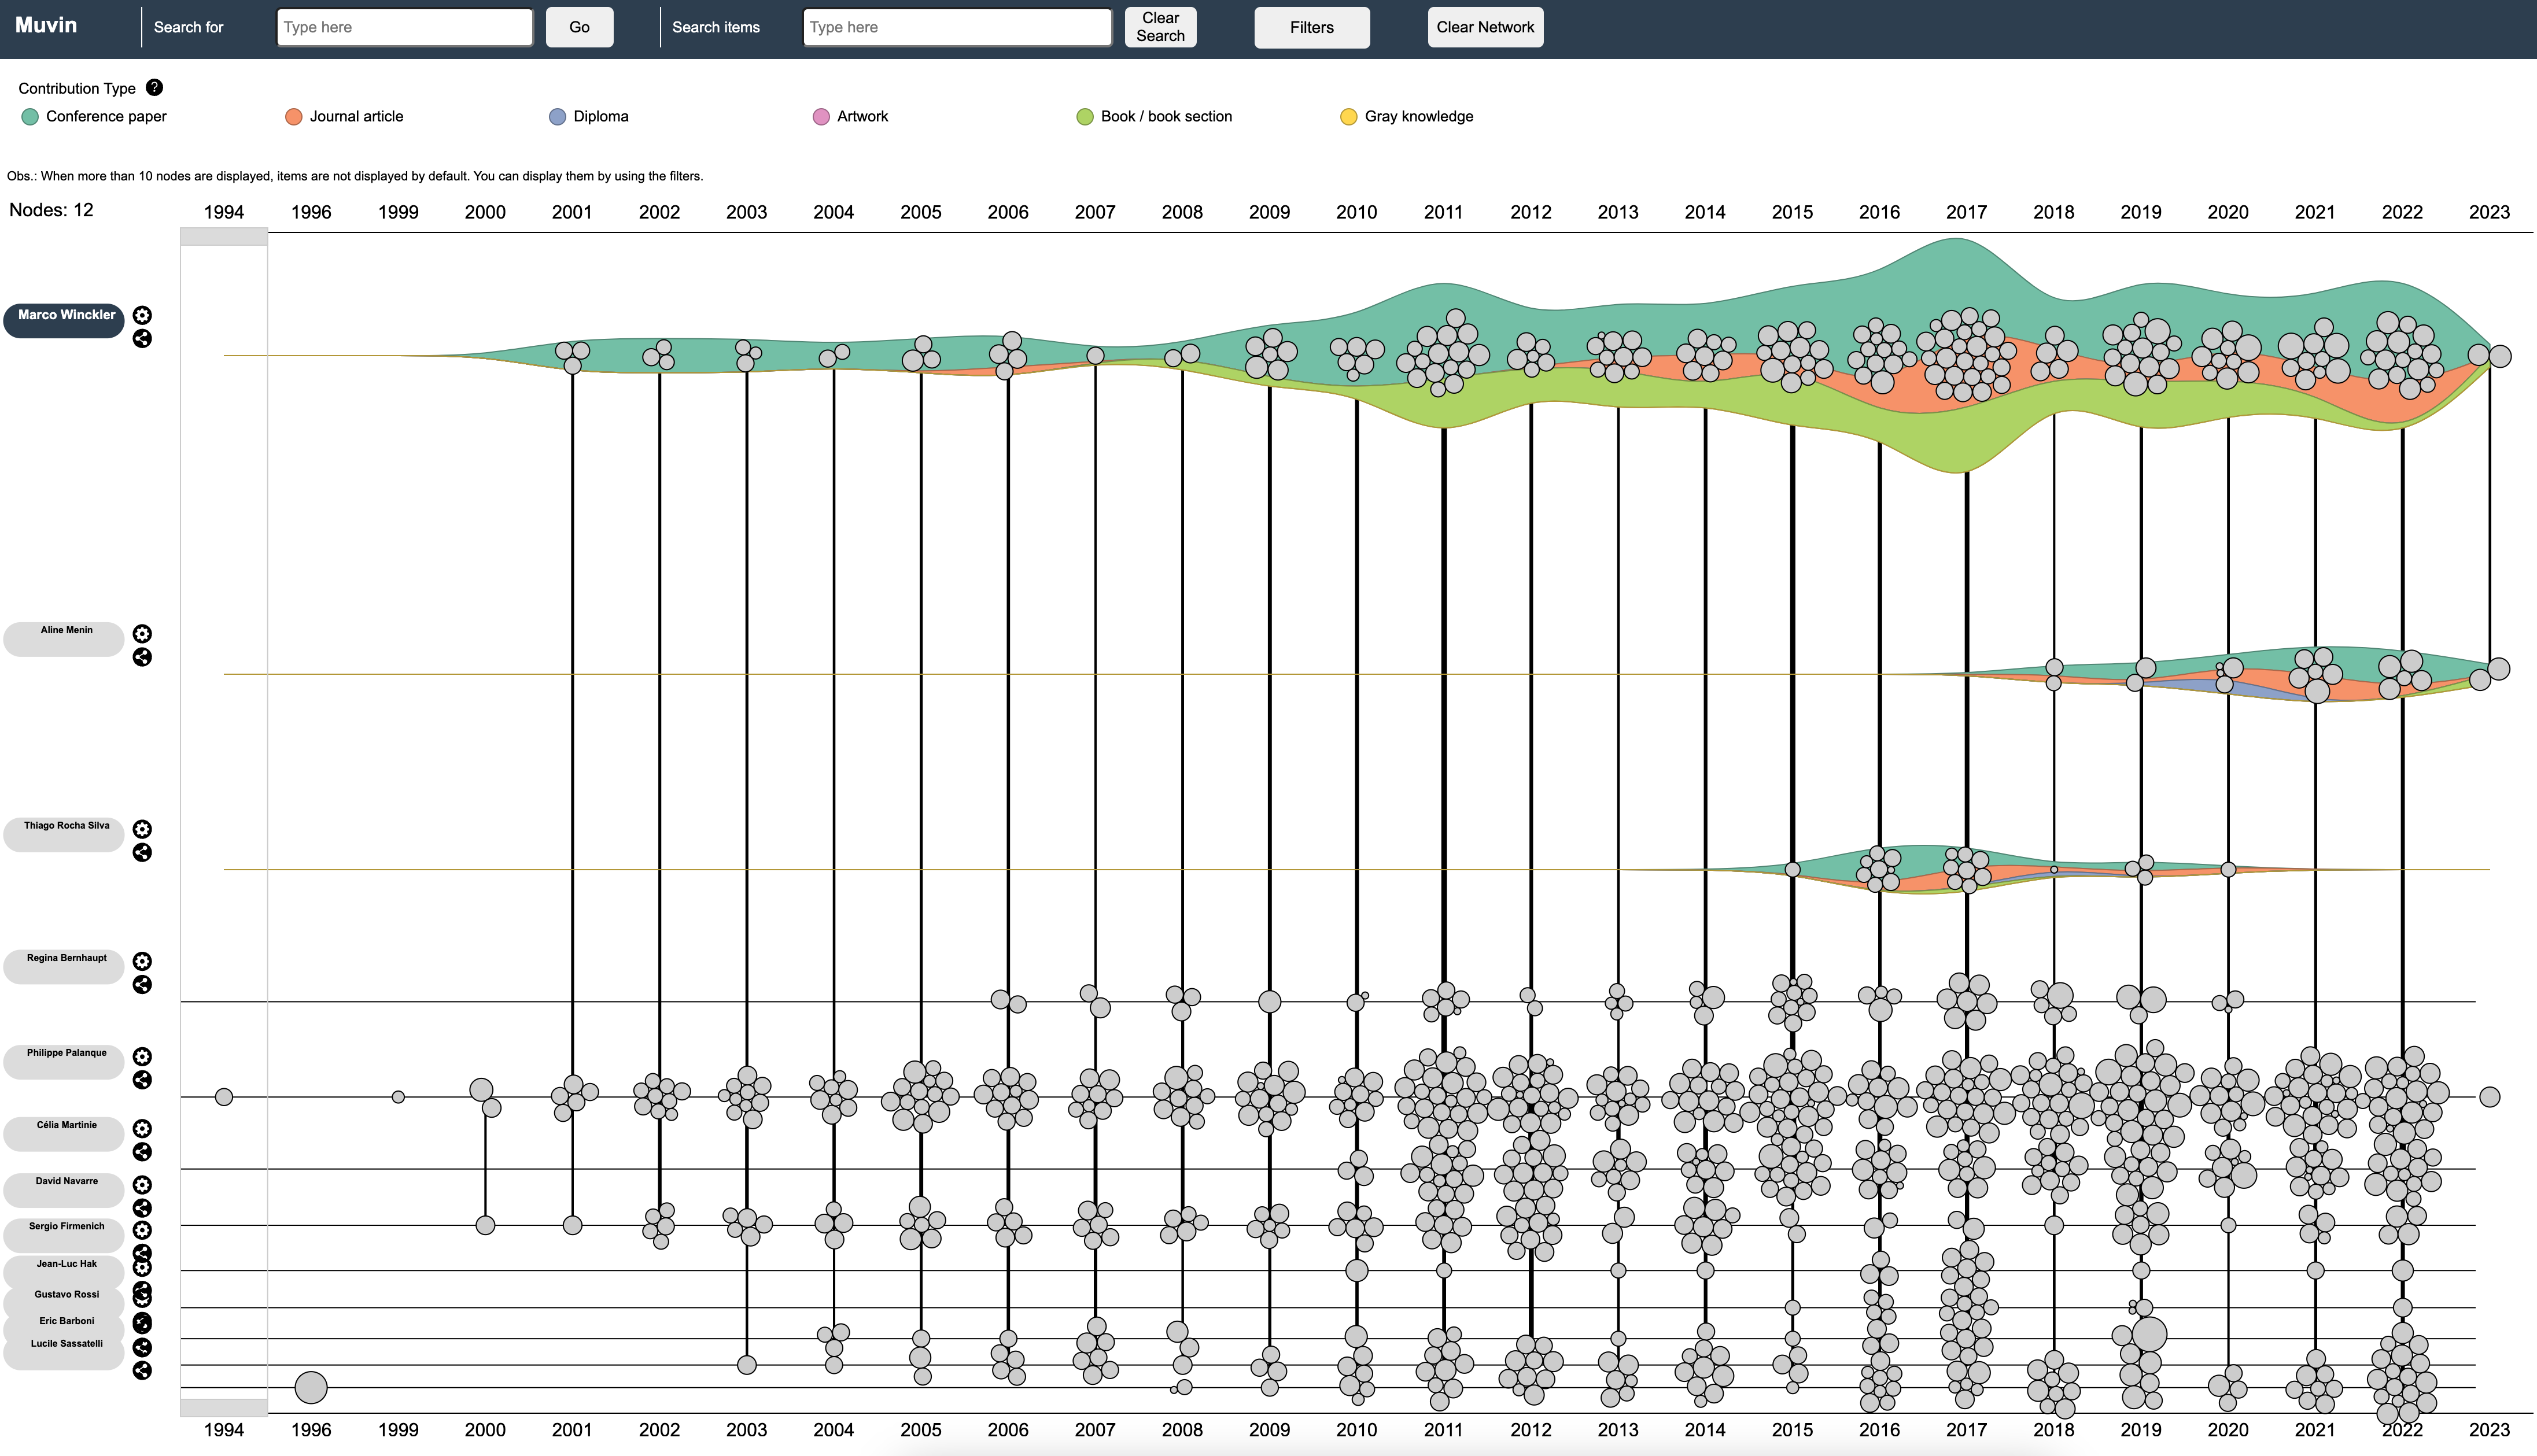
It comprises a timeline, where the x-axis encodes time in years and the y-axis represents the nodes of the network. The exploration follows an incremental approach in which the user chooses an author to begin the exploration. Stream-graphs provide then an overview of the author's production over time in terms of quantity (area's height) and type (color) of production, e.g. in the case of scientific publications the type corresponds to conference papers, journal articles, books, etc. Each item is represented as a dark red circle, which size encodes the number of collaborators. Both nodes and items are embedded with tooltips that provide supplemental information and a contextual menu that support operations such as navigate to data source, import data, hide author, etc.
A node-link diagram displays the collaborations between then through a \textbf{juxtaposed layout} displaying the individual profiles side by side as well as the network changes over time. At first, the collaborations of a person are represented through single black lines that connect people vertically at the years where a collaboration has been detected, i.e. there is at least one item in which they worked together. By hovering over a person's name, the system highlights all the items in which they collaborated with at least one other person being displayed, revealing at a glance the temporal collaboration patterns of two or more people, i.e. when, for how long and on how many items they worked together.
By using a focus+context technique, the user can focus on a particular author and then explore the relationships at a particular time unit. By clicking on a particular year, the timeline is stretched horizontally, revealing a node-link diagram linking together the different items co-authored by the displayed authors.
Obs.: We advice using Google Chrome with this tool, as some features might not work correctly on other browsers.
Source code is available at https://github.com/Wimmics/muvin.