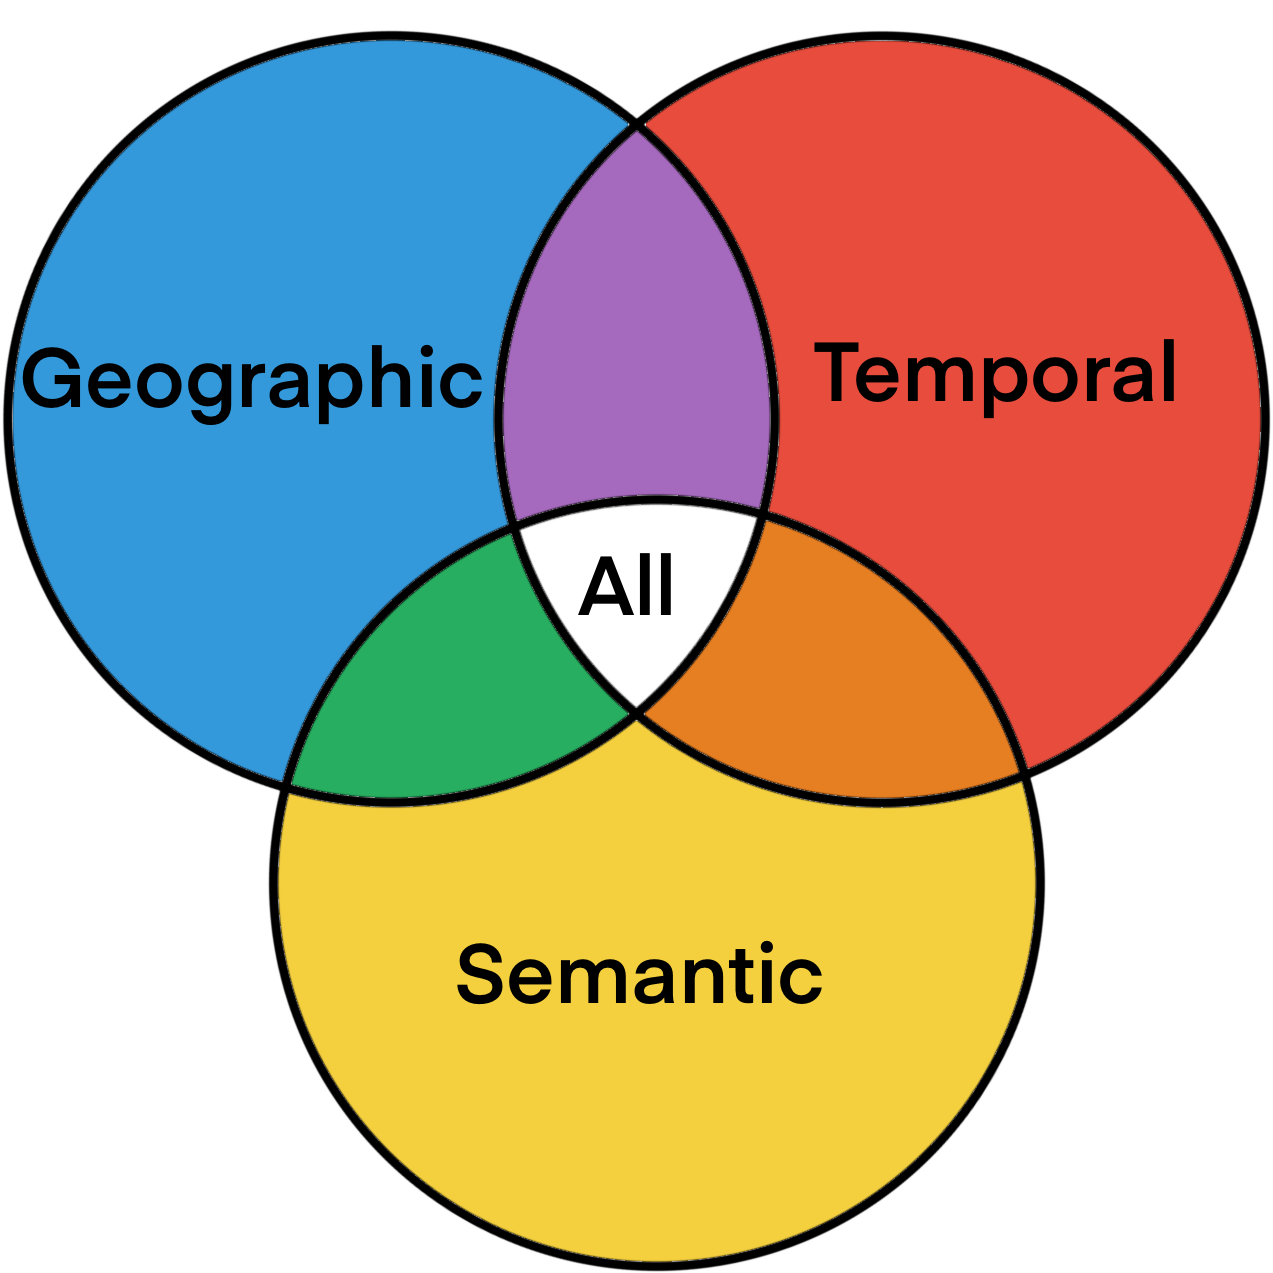
Glyph name explanations
Semantic
Geographic
Temporal
C = Circle
P = Pie Chart
S = SunBurst
Cl = Cluster
Co = Country
0 = No temporal display
1 = Temporal display
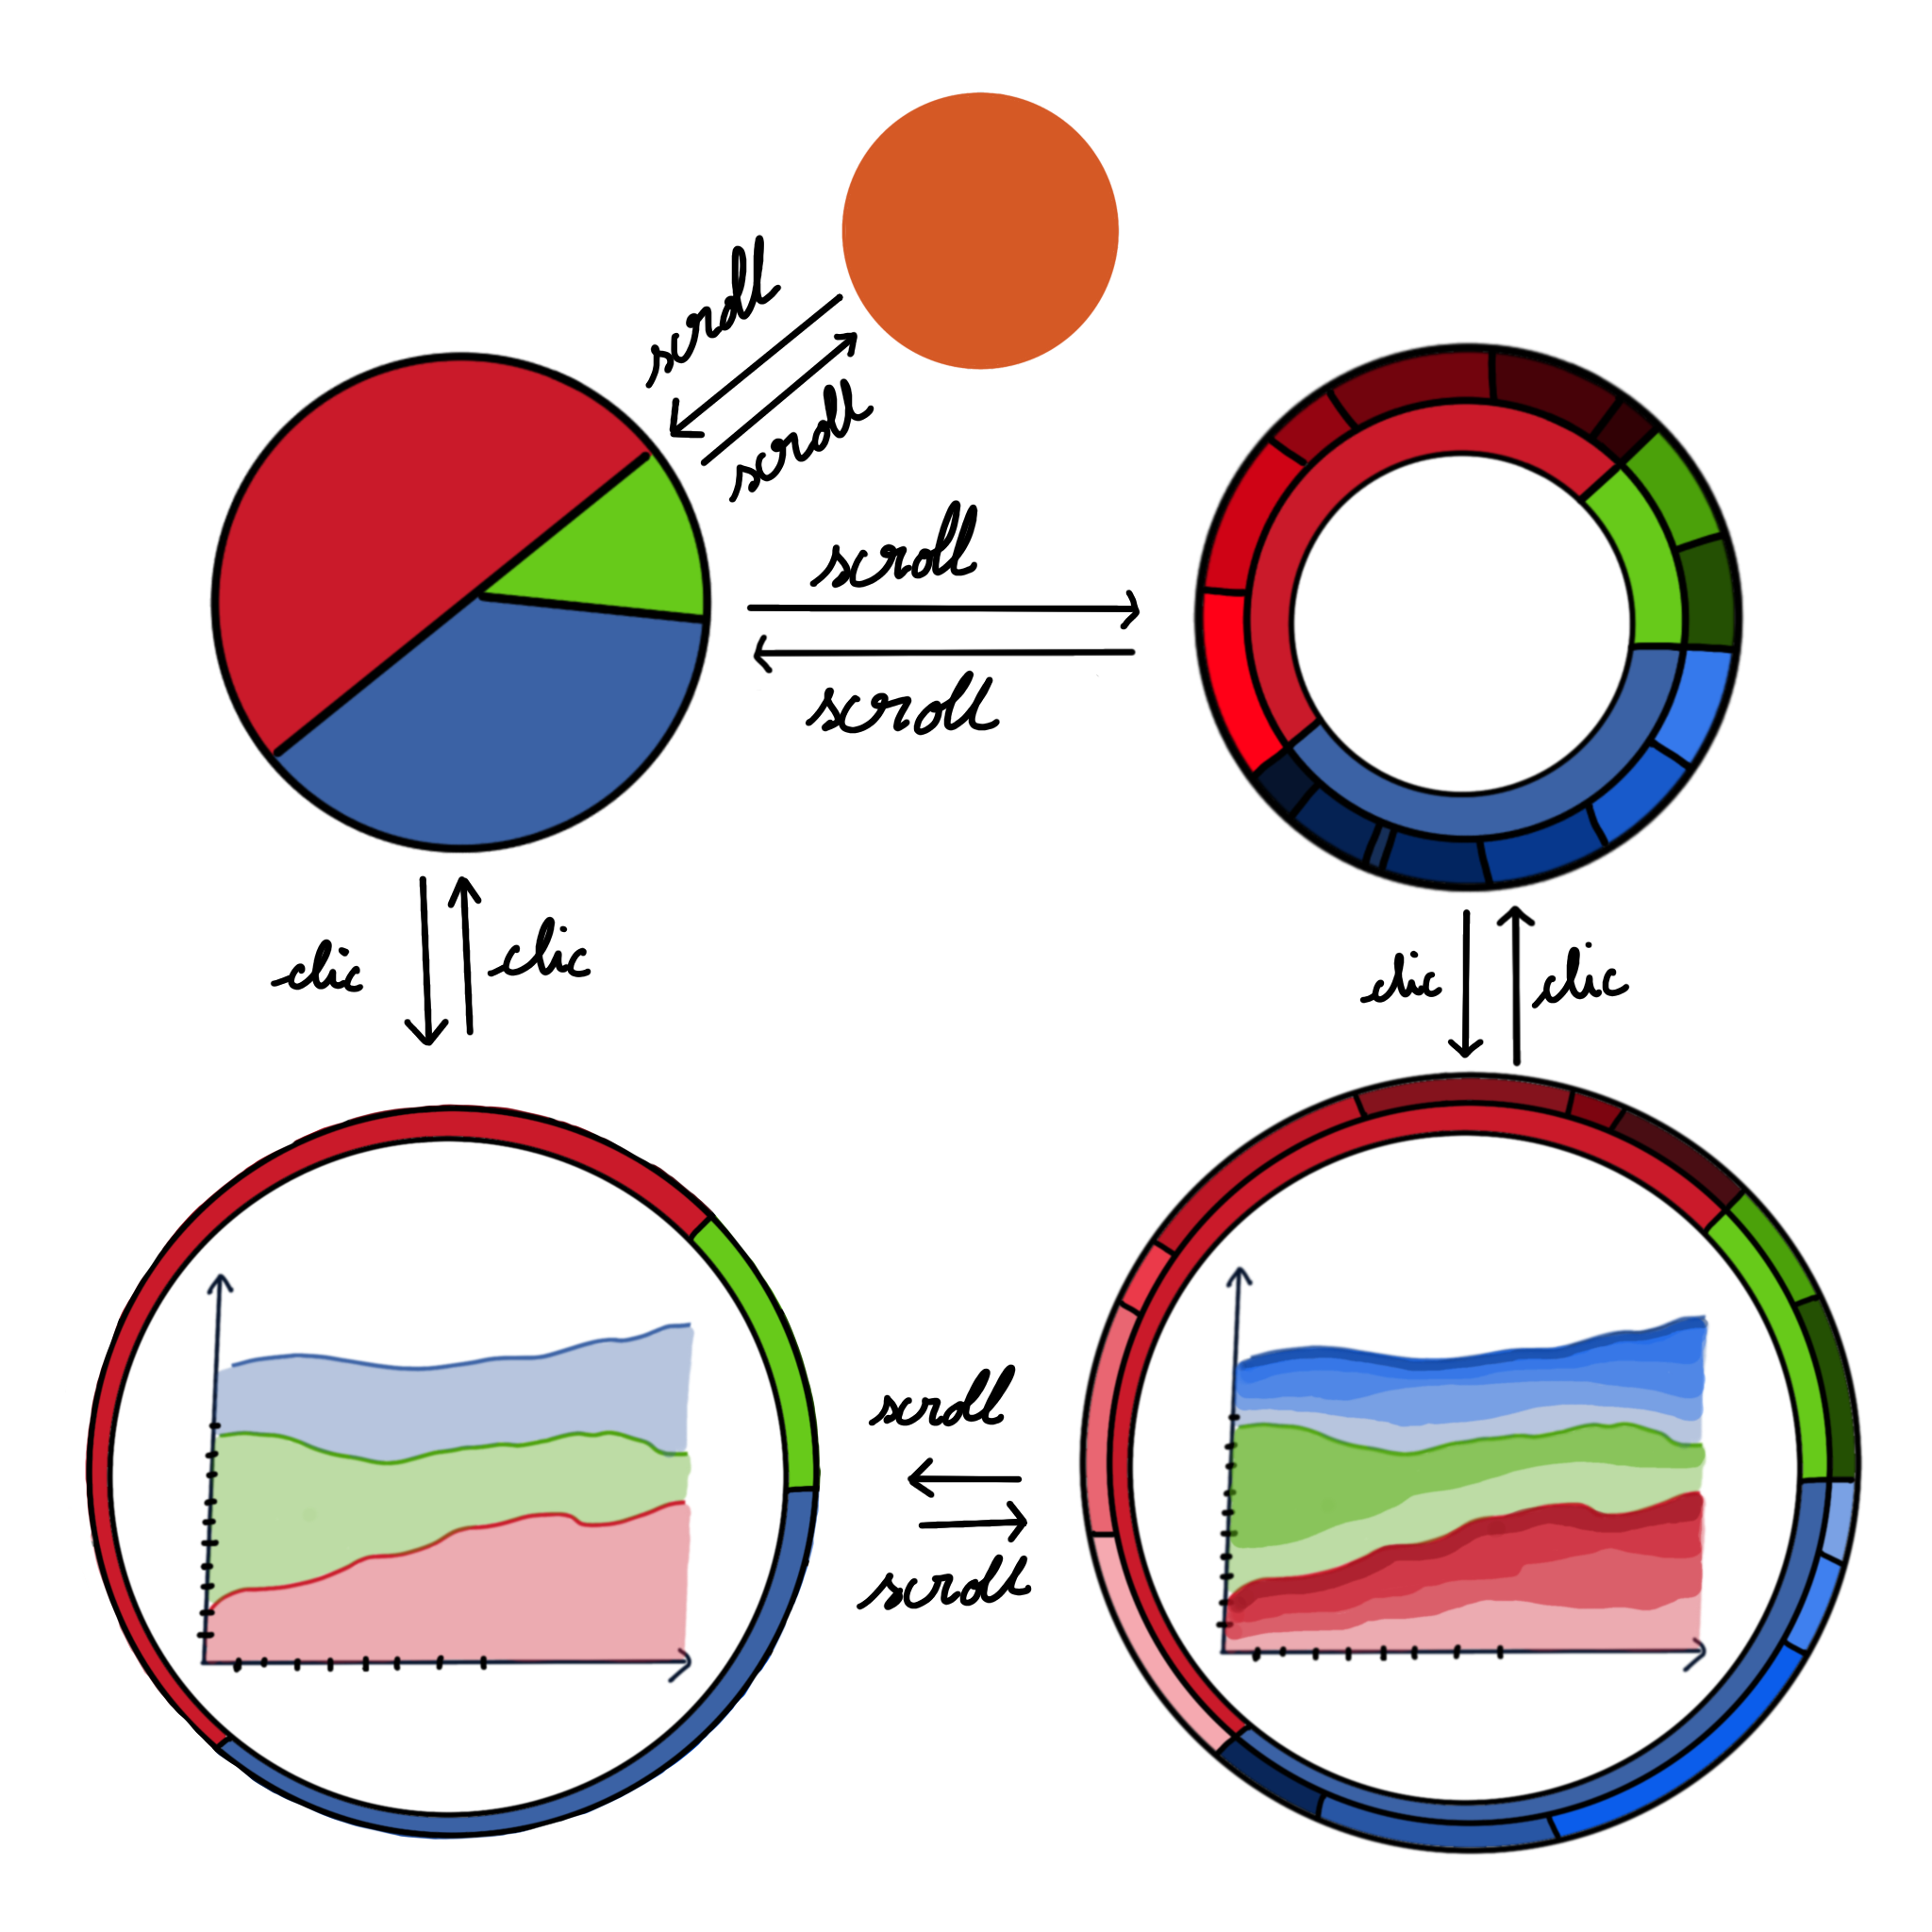
Glyph behaviour explanations
Circle, Pie Chart and SunBurst
are all circle based glyphs that allow
to represent a different number of dimensions such as the dataset from which the
datapoint is taken, or its category.
Glyphs either use data from a specific country or a group of country, which is called cluster.
Each glyph may contain temporal information through the display of a stacked area chart in the middle of the glyph.
Every glyph has a unique name that can be created through the use of these 3 features.
For example the glyph C-Co-1 is a circle (C) that takes information from a country (Co) and displays temporal information (1).
Title 1
Title 2
Description 2
Title 2
Description 2
Title 2
Description 2
Title 2
Description 2
Title 2
Description 2
Title 2
Description 2
Title 2
Description
Title 2
Description
Title 2
Description 2
Title 2
Description 2
Title 2
Description 2